



What is Cumulative Layout Shift (CLS)?
Cumulative Layout Shift (CLS) is one of Google’s three Core Web Vitals and measures the visual stability of a web page. The metric captures how much visible content moves around unexpectedly while the page loads, for example when a late loading image pushes the text you were already reading further down. A CLS value of 0.1 or less counts as good, measured at the 75th percentile of all real page views.
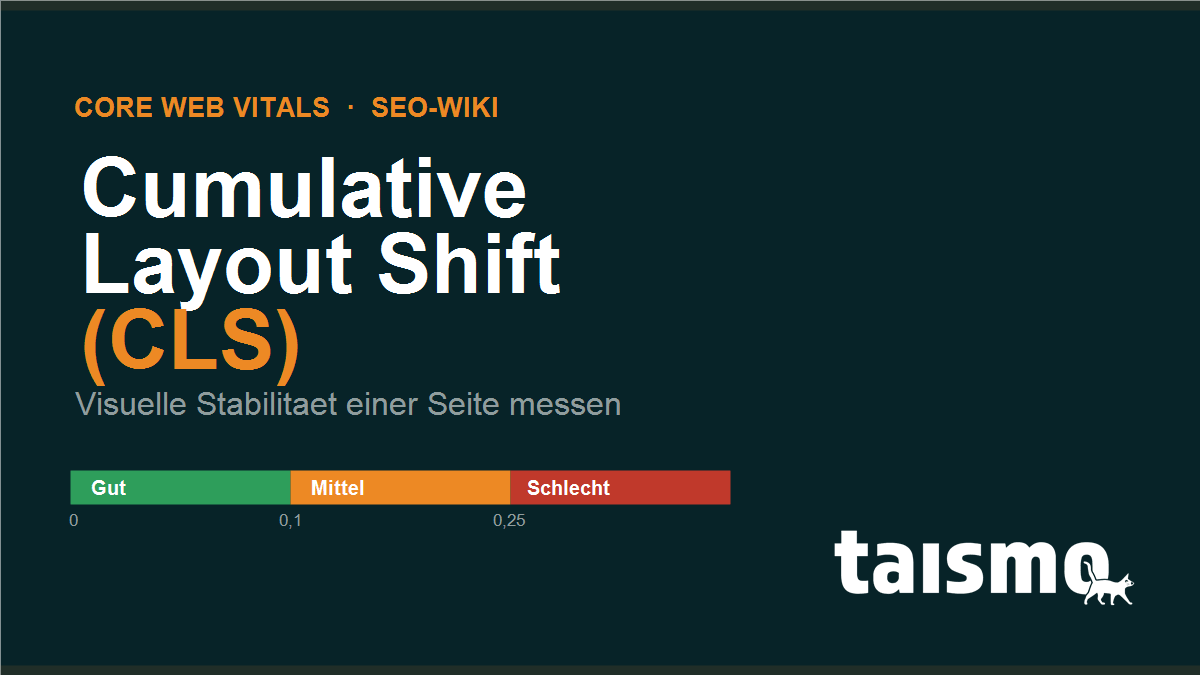
CLS has been one of the official Core Web Vitals since 2021, the set of metrics Google uses to rate the user experience of a page. While Largest Contentful Paint measures loading speed and Interaction to Next Paint measures responsiveness, CLS stands for visual calm: nothing should slide away under the visitor’s finger while the page is still loading.
Cumulative Layout Shift at a glance
| Property | Detail |
|---|---|
| Category | Core Web Vital (field metric for visual stability) |
| Abbreviation | CLS (Cumulative Layout Shift) |
| Unit | dimensionless number (no time value, no seconds) |
| Good value | ≤ 0.1 · needs improvement 0.1 to 0.25 · poor > 0.25 |
| Rating point | 75th percentile of all page views (mobile and desktop rated separately) |
| Related metrics | Largest Contentful Paint (LCP), Interaction to Next Paint (INP) |
What exactly does Cumulative Layout Shift measure?
CLS measures the sum of all unexpected layout shifts that happen over the whole lifetime of a page. A layout shift occurs whenever an element that is already visible changes its position between two rendered frames without the visitor having triggered an action.
The score of every single shift comes from two factors that are multiplied with each other:
- Impact fraction: how much of the visible screen is affected by the shift.
- Distance fraction: how far the element has moved relative to the viewport.
An element that takes up half the screen height and slides down by a quarter of that height therefore produces a layout shift score of 0.5 × 0.25 = 0.125. One point matters: since 2021, CLS no longer adds up every shift in a session, only the strongest connected burst of shifts (the so called session window). That keeps long lived single page applications from piling up artificially bad values.
Only unexpected shifts count. If content moves as a direct reaction to a click or a key press within 500 milliseconds, the shift is not counted, because the visitor caused it.
What is a good CLS value?
A good CLS value is 0.1 or below. Google splits the scale into three bands: up to 0.1 a page counts as “good”, between 0.1 and 0.25 as “needs improvement” and above 0.25 as “poor”. What decides is neither the best nor the average measurement, it is the 75th percentile, so the value that 75 percent of all real page views reach or beat.
Because the 75th percentile is what counts, it is not enough for the page to load stably on your own fast test device. Google relies on field data from real visitors with different devices and connections. A single jumpy banner on slow smartphones can already push the value past the mark.
What causes layout shifts?
Layout shifts almost always come down to the same thing: the browser has to make room for an element that only arrives later, and it pushes the content it has already rendered out of the way. The most common causes:
- Images without size attributes: if
widthandheight(or anaspect-ratio) are missing, the browser only learns the image dimensions while loading and pushes the following content down. The right image format changes nothing about that, what matters is the reserved area. - Ads, embeds and iframes without fixed dimensions: ads, social media embeds or video players load asynchronously and shove existing content aside when no placeholder is defined.
- Content loaded in dynamically: cookie banners, newsletter boxes or “related articles” that get inserted through JavaScript above existing content.
- Web fonts (FOIT and FOUT): when a font arrives late and the text reflows from the fallback to the target font, line lengths and heights change.
- Sloppy lazy loading: images that load late without a reserved area shift the layout at exactly the moment the visitor scrolls.
How is CLS measured?
CLS is collected in two ways: through field data from real visitors and through lab tests. Only the field data counts for the Google rating.
- Field data: the Chrome User Experience Report (CrUX) collects CLS values anonymously from real Chrome users. This data feeds into PageSpeed Insights and into the Core Web Vitals report of Google Search Console, and it is the basis of the actual rating.
- Lab data: tools such as Lighthouse or the Chrome DevTools simulate a single page view under controlled conditions. They are good for tracking down causes, but they do not mirror the real spread of visitors.
- JavaScript measurement: the open
web-vitalslibrary from Google records CLS directly in the browser and can be wired up to any analytics tool.
One difference is central: lab tools only measure CLS up to the initial load, field data covers the whole session including scrolling and interaction. That is why a Lighthouse score can be green while Search Console reports red.
How do you reduce CLS?
You reduce CLS by telling the browser from the start how much space every element needs. The most effective measures:
- Set image and video dimensions: always give
widthandheight(oraspect-ratioin CSS) so that the browser reserves the area in advance. - Reserve space for ads and embeds: define fixed container heights for ads, iframes and dynamic boxes instead of letting them push the content away.
- Never insert content above existing content: place banners and notices below the visible content or as an overlay, not on top of it.
- Tune your web fonts: use
font-display: optionalorswapwith a matching fallback font and preload the most important font file. - Animate with
transform: build movement withtransforminstead of layout triggering properties such astoporheight.
In practice it pays to start with the largest visible elements, because that is where every correction moves the score the most. If you do not know which elements trigger the shift, you find the culprits in the Search Console report or in the “Layout Shift” layer of the Chrome DevTools. A structured technical check of this and the other Core Web Vitals is a fixed part of an SEO audit.
Frequently asked questions about CLS
Is CLS a ranking factor?
Yes, CLS is part of the Core Web Vitals and therefore a confirmed, though weak, ranking signal. With comparable relevance a good CLS value can tip the scales, but it does not replace strong content.
Why is my CLS worse on mobile than on desktop?
On smartphones the viewport is smaller, so the same shift takes up relatively more of the screen. On top of that, mobile connections load images and ads more slowly, which makes layout shifts more likely.
Does a shift after a click count towards CLS?
No, shifts that follow a user action within 500 milliseconds count as expected and do not feed into the CLS value.
Welt der SEO lernen?